In the previous chapters, we learned how to setup highcharts library and how to create a chart with required configurations using highcharts library in our webpage. Now, we will learn how to create a waterfall chart using highcharts library with examples.
Following is the example of creating a waterfall chart by setting the required chart properties using highcharts library.
<html>
<head>
<title>Highcharts Waterfall Chart</title>
<script src="https://code.jquery.com/jquery-3.4.1.min.js"></script>
<script src="https://code.highcharts.com/highcharts.js"></script>
<script src="https://code.highcharts.com/highcharts-more.js"></script>
<script src="https://code.highcharts.com/modules/exporting.js"></script>
<script type="text/javascript">
$(function() {
Highcharts.chart('container', {
chart: {
type: 'waterfall'
},
title: {
text: 'Highcharts Waterfall'
},
xAxis: {
type: 'category'
},
yAxis: {
title: {
text: 'USD'
}
},
legend: {
enabled: false
},
tooltip: {
pointFormat: '<b>${point.y:,.2f}</b> USD'
},
series: [{
upColor: Highcharts.getOptions().colors[2],
color: Highcharts.getOptions().colors[3],
data: [{
name: 'Start',
y: 120000
}, {
name: 'Product Revenue',
y: 569000
}, {
name: 'Service Revenue',
y: 231000
}, {
name: 'Positive Balance',
isIntermediateSum: true,
color: Highcharts.getOptions().colors[1]
}, {
name: 'Fixed Costs',
y: -342000
}, {
name: 'Variable Costs',
y: -233000
}, {
name: 'Balance',
isSum: true,
color: Highcharts.getOptions().colors[1]
}],
dataLabels: {
enabled: true,
formatter: function() {
return Highcharts.numberFormat(this.y / 1000, 0, ',') + 'k';
},
style: {
fontWeight: 'bold'
}
},
pointPadding: 0
}]
});
});
</script>
</head>
<body>
<div id="container"></div>
</body>
</html>
If you observe the above example, we created a waterfall chart using highcharts library with required properties.
When we execute the above highcharts example, we will get the result like as shown below.
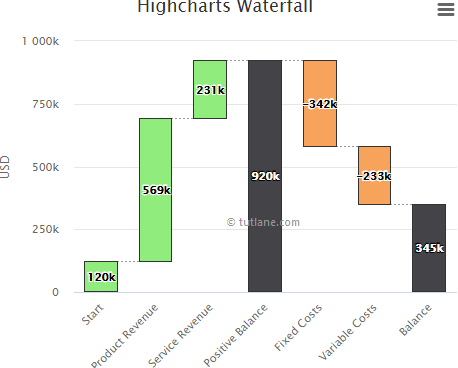
This is how we can create a waterfall chart using highcharts library with required properties.