In the previous chapters, we learned how to setup highcharts library and how to create a chart with required configurations using highcharts library in our webpage. Now, we will learn how to create area spline chart using highcharts library with examples.
Following is the example of creating an area spline chart by setting the required area chart properties using highcharts library.
<html>
<head>
<title>Highcharts Area Spline Chart</title>
<script src="https://code.jquery.com/jquery-3.4.1.min.js"></script>
<script src="https://code.highcharts.com/highcharts.js"></script>
<script src="https://code.highcharts.com/modules/exporting.js"></script>
<script type="text/javascript">
$(function() {
Highcharts.chart('container', {
chart: {
type: 'areaspline'
},
title: {
text: 'Average fruit consumption during one week'
},
legend: {
layout: 'vertical',
align: 'left',
verticalAlign: 'top',
x: 150,
y: 100,
floating: true,
borderWidth: 1,
backgroundColor: (Highcharts.theme && Highcharts.theme.legendBackgroundColor) || '#FFFFFF'
},
xAxis: {
categories: [
'Monday',
'Tuesday',
'Wednesday',
'Thursday',
'Friday',
'Saturday',
'Sunday'
],
plotBands: [{ // visualize the weekend
from: 4.5,
to: 6.5,
color: 'rgba(68, 170, 213, .2)'
}]
},
yAxis: {
title: {
text: 'Fruit units'
}
},
tooltip: {
shared: true,
valueSuffix: ' units'
},
credits: {
enabled: false
},
plotOptions: {
areaspline: {
fillOpacity: 0.5
}
},
series: [{
name: 'John',
data: [3, 4, 3, 5, 4, 10, 12]
}, {
name: 'Jane',
data: [1, 3, 4, 3, 3, 5, 4]
}]
});
});
</script>
</head>
<body>
<div id="container" style="width: 100%; height: 400px;"> </div>
</body>
</html>
If you observe the above example, we created an area spline chart using highcharts library with required properties.
When we execute the above highcharts example, we will get the result like as shown below.
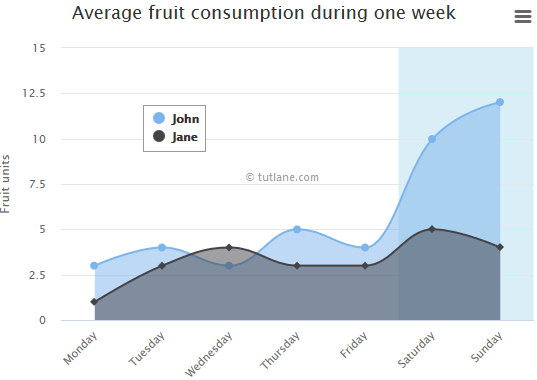
This is how we can create area spline chart using highcharts library with required properties.