In the previous chapters, we learned how to setup highcharts library and how to create a chart with required configurations using highcharts library in our webpage. Now, we will learn how to create a 3d scatter chart using highcharts library with examples.
Following is the example of creating a 3D scatter chart by setting the required chart properties using highcharts library.
<html>
<head>
<title>Highcharts 3D Scatter Chart</title>
<script src="https://code.jquery.com/jquery-3.4.1.min.js"></script>
<script src="https://code.highcharts.com/highcharts.js"></script>
<script src="https://code.highcharts.com/highcharts-3d.js"></script>
<script src="https://code.highcharts.com/modules/exporting.js"></script>
<script src="https://code.highcharts.com/modules/export-data.js"></script>
<script type="text/javascript">
$(function() {
// Give the points a 3D feel by adding a radial gradient
Highcharts.setOptions({
colors: Highcharts.getOptions().colors.map(function(color) {
return {
radialGradient: {
cx: 0.4,
cy: 0.3,
r: 0.5
},
stops: [
[0, color],
[1, Highcharts.Color(color).brighten(-0.2).get('rgb')]
]
};
})
});
// Set up the chart
var chart = new Highcharts.Chart({
chart: {
renderTo: 'container',
margin: 100,
type: 'scatter3d',
animation: false,
options3d: {
enabled: true,
alpha: 10,
beta: 30,
depth: 250,
viewDistance: 5,
fitToPlot: false,
frame: {
bottom: {
size: 1,
color: 'rgba(0,0,0,0.02)'
},
back: {
size: 1,
color: 'rgba(0,0,0,0.04)'
},
side: {
size: 1,
color: 'rgba(0,0,0,0.06)'
}
}
}
},
title: {
text: 'Draggable box'
},
subtitle: {
text: 'Click and drag the plot area to rotate in space'
},
plotOptions: {
scatter: {
width: 10,
height: 10,
depth: 10
}
},
yAxis: {
min: 0,
max: 10,
title: null
},
xAxis: {
min: 0,
max: 10,
gridLineWidth: 1
},
zAxis: {
min: 0,
max: 10,
showFirstLabel: false
},
legend: {
enabled: false
},
series: [{
name: 'Reading',
colorByPoint: true,
data: [
[1, 6, 5], [8, 7, 9], [1, 3, 4], [4, 6, 8], [5, 7, 7], [6, 9, 6],
[7, 0, 5], [2, 3, 3], [3, 9, 8], [3, 6, 5], [4, 9, 4], [2, 3, 3],
[6, 9, 9], [0, 7, 0], [7, 7, 9], [7, 2, 9], [0, 6, 2], [4, 6, 7],
[3, 7, 7], [0, 1, 7], [2, 8, 6], [2, 3, 7], [6, 4, 8], [3, 5, 9],
[7, 9, 5], [3, 1, 7], [4, 4, 2], [3, 6, 2], [3, 1, 6], [6, 8, 5],
[6, 6, 7], [4, 1, 1], [7, 2, 7], [7, 7, 0], [8, 8, 9], [9, 4, 1],
[8, 3, 4], [9, 8, 9], [3, 5, 3], [0, 2, 4], [6, 0, 2], [2, 1, 3],
[5, 8, 9], [2, 1, 1], [9, 7, 6], [3, 0, 2], [9, 9, 0], [3, 4, 8],
[2, 6, 1], [8, 9, 2], [7, 6, 5], [6, 3, 1], [9, 3, 1], [8, 9, 3],
[9, 1, 0], [3, 8, 7], [8, 0, 0], [4, 9, 7], [8, 6, 2], [4, 3, 0],
[2, 3, 5], [9, 1, 4], [1, 1, 4], [6, 0, 2], [6, 1, 6], [3, 8, 8],
[8, 8, 7], [5, 5, 0], [3, 9, 6], [5, 4, 3], [6, 8, 3], [0, 1, 5],
[6, 7, 3], [8, 3, 2], [3, 8, 3], [2, 1, 6], [4, 6, 7], [8, 9, 9],
[5, 4, 2], [6, 1, 3], [6, 9, 5], [4, 8, 2], [9, 7, 4], [5, 4, 2],
[9, 6, 1], [2, 7, 3], [4, 5, 4], [6, 8, 1], [3, 4, 0], [2, 2, 6],
[5, 1, 2], [9, 9, 7], [6, 9, 9], [8, 4, 3], [4, 1, 7], [6, 2, 5],
[0, 4, 9], [3, 5, 9], [6, 9, 1], [1, 9, 2]]
}]
});
// Add mouse and touch events for rotation
(function(H) {
function dragStart(eStart) {
eStart = chart.pointer.normalize(eStart);
var posX = eStart.chartX,
posY = eStart.chartY,
alpha = chart.options.chart.options3d.alpha,
beta = chart.options.chart.options3d.beta,
sensitivity = 5, // lower is more sensitive
handlers = [];
function drag(e) {
// Get e.chartX and e.chartY
e = chart.pointer.normalize(e);
chart.update({
chart: {
options3d: {
alpha: alpha + (e.chartY - posY) / sensitivity,
beta: beta + (posX - e.chartX) / sensitivity
}
}
}, undefined, undefined, false);
}
function unbindAll() {
handlers.forEach(function(unbind) {
if (unbind) {
unbind();
}
});
handlers.length = 0;
}
handlers.push(H.addEvent(document, 'mousemove', drag));
handlers.push(H.addEvent(document, 'touchmove', drag));
handlers.push(H.addEvent(document, 'mouseup', unbindAll));
handlers.push(H.addEvent(document, 'touchend', unbindAll));
}
H.addEvent(chart.container, 'mousedown', dragStart);
H.addEvent(chart.container, 'touchstart', dragStart);
}(Highcharts));
});
</script>
</head>
<body>
<div id="container" style="width: 100%; height: 400px;"> </div>
</body>
</html>
If you observe the above example, we created a 3D scatter chart using highcharts library with required properties.
When we execute the above highcharts example, we will get the result like as shown below.
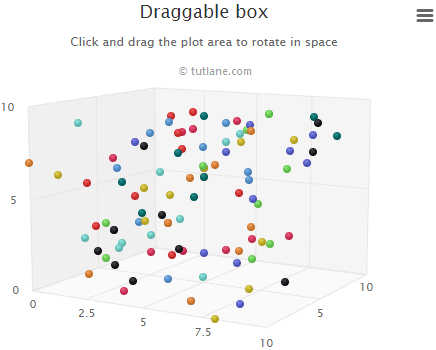
This is how we can create a 3D scatter chart using highcharts library with required properties.