In the previous chapters, we learned how to setup highcharts library and how to create a chart with required configurations using highcharts library in our webpage. Now, we will learn how to create a 3D bubbles chart using highcharts library with examples.
Following is the example of creating a 3D bubbles chart by setting the required chart properties using highcharts library.
<html>
<head>
<title>Highcharts 3D Bubbles Chart</title>
<script src="https://code.jquery.com/jquery-3.4.1.min.js"></script>
<script src="https://code.highcharts.com/highcharts.js"></script>
<script src="https://code.highcharts.com/highcharts-more.js"></script>
<script type="text/javascript">
$(function() {
Highcharts.chart('container', {
chart: {
type: 'bubble',
plotBorderWidth: 1,
zoomType: 'xy'
},
title: {
text: 'Highcharts bubbles with radial gradient fill'
},
xAxis: {
gridLineWidth: 1
},
yAxis: {
startOnTick: false,
endOnTick: false
},
series: [{
data: [ [9, 81, 63], [98, 5, 89], [51, 50, 73], [41, 22, 14], [58, 24, 20],
[78, 37, 34], [55, 56, 53], [18, 45, 70], [42, 44, 28], [3, 52, 59],
[31, 18, 97], [79, 91, 63], [93, 23, 23], [44, 83, 22]
],
marker: {
fillColor: {
radialGradient: {
cx: 0.4,
cy: 0.3,
r: 0.7
},
stops: [
[0, 'rgba(255,255,255,0.5)'],
[1, Highcharts.Color(Highcharts.getOptions().colors[0]).setOpacity(0.5).get('rgba')]
]
}
}
}, {
data: [ [42, 38, 20], [6, 18, 1], [1, 93, 55], [57, 2, 90], [80, 76, 22],
[11, 74, 96], [88, 56, 10], [30, 47, 49], [57, 62, 98], [4, 16, 16],
[46, 10, 11], [22, 87, 89], [57, 91, 82], [45, 15, 98]
],
marker: {
fillColor: {
radialGradient: {
cx: 0.4,
cy: 0.3,
r: 0.7
},
stops: [
[0, 'rgba(255,255,255,0.5)'],
[1, Highcharts.Color(Highcharts.getOptions().colors[1]).setOpacity(0.5).get('rgba')]
]
}
}
}]
});
});
</script>
</head>
<body>
<div id="container" style="width: 100%; height: 400px;"> </div>
</body>
</html>
If you observe the above example, we created a 3D bubbles chart using highcharts library with required properties.
When we execute the above highcharts example, we will get the result like as shown below.
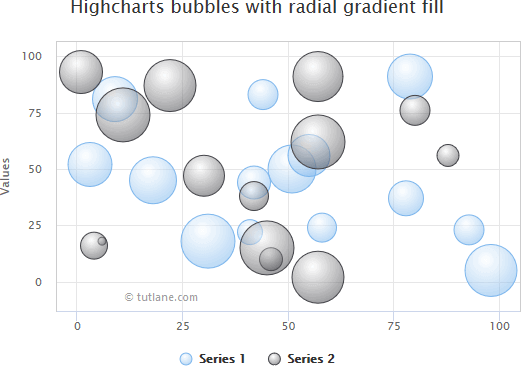
This is how we can create a 3D bubbles chart using highcharts library with required properties.