In the previous chapters, we learned how to setup highcharts library and how to create a chart with required configurations using highcharts library in our webpage. Now, we will learn how to create a pie chart with gradient fill using highcharts library with examples.
Following is the example of creating a pie chart with gradient fill by setting the required chart properties using highcharts library.
<html>
<head>
<title>Highcharts Gradient Fill Pie Chart</title>
<script src="https://code.jquery.com/jquery-3.4.1.min.js"></script>
<script src="https://code.highcharts.com/highcharts.js"></script>
<script src="https://code.highcharts.com/modules/exporting.js"></script>
<script src="https://code.highcharts.com/modules/export-data.js"></script>
<script type="text/javascript">
$(function() {
// Radialize the colors
Highcharts.setOptions({
colors: Highcharts.map(Highcharts.getOptions().colors, function(color) {
return {
radialGradient: {
cx: 0.5,
cy: 0.3,
r: 0.7
},
stops: [
[0, color],
[1, Highcharts.Color(color).brighten(-0.3).get('rgb')] // darken
]
};
})
});
// Build the chart
Highcharts.chart('container', {
chart: {
plotBackgroundColor: null,
plotBorderWidth: null,
plotShadow: false,
type: 'pie'
},
title: {
text: 'Browser market shares in January, 2018'
},
tooltip: {
pointFormat: '{series.name}: <b>{point.percentage:.1f}%</b>'
},
plotOptions: {
pie: {
allowPointSelect: true,
cursor: 'pointer',
dataLabels: {
enabled: true,
format: '<b>{point.name}</b>: {point.percentage:.1f} %',
style: {
color: (Highcharts.theme && Highcharts.theme.contrastTextColor) || 'black'
},
connectorColor: 'silver'
}
}
},
series: [{
name: 'Share',
data: [
{name: 'Chrome',y: 61.41},
{name: 'Internet Explorer',y: 11.84},
{name: 'Firefox',y: 10.85},
{name: 'Edge',y: 4.67},
{name: 'Safari',y: 4.18},
{name: 'Other',y: 7.05}
]
}]
});
});
</script>
</head>
<body>
<div id="container" style="width: 100%; height: 400px;"> </div>
</body>
</html>
If you observe the above example, we created a pie chart with gradient fill options using highcharts library with required properties.
When we execute the above highcharts example, we will get the result like as shown below.
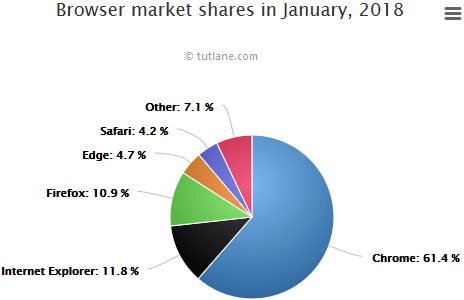
This is how we can create a pie chart with gradient fill using highcharts library with required properties.