In the previous chapters, we learned how to setup highcharts library and how to create a chart with required configurations using highcharts library in our webpage. Now, we will learn how to create a 3d cylinder chart using highcharts library with examples.
Following is the example of creating a 3D cylinder chart by setting the required chart properties using highcharts library.
<html>
<head>
<title>Highcharts 3D Cylinder Chart</title>
<script src="https://code.jquery.com/jquery-3.4.1.min.js"></script>
<script src="https://code.highcharts.com/highcharts.js"></script>
<script src="https://code.highcharts.com/highcharts-3d.js"></script>
<script src="https://code.highcharts.com/modules/cylinder.js"></script>
<script src="https://code.highcharts.com/modules/exporting.js"></script>
<script src="https://code.highcharts.com/modules/export-data.js"></script>
<script type="text/javascript">
$(function() {
Highcharts.chart('container', {
chart: {
type: 'cylinder',
options3d: {
enabled: true,
alpha: 15,
beta: 15,
depth: 50,
viewDistance: 25
}
},
title: {
text: 'Highcharts Cylinder Chart'
},
plotOptions: {
series: {
depth: 25,
colorByPoint: true
}
},
series: [{
data: [29.9, 71.5, 106.4, 129.2, 144.0, 176.0, 135.6, 148.5, 216.4, 194.1, 95.6, 54.4],
name: 'Cylinders',
showInLegend: false
}]
});
});
</script>
</head>
<body>
<div id="container" style="width: 100%; height: 400px;"> </div>
</body>
</html>
If you observe the above example, we created a 3D cylinder chart using highcharts library with required properties.
When we execute the above highcharts example, we will get the result like as shown below.
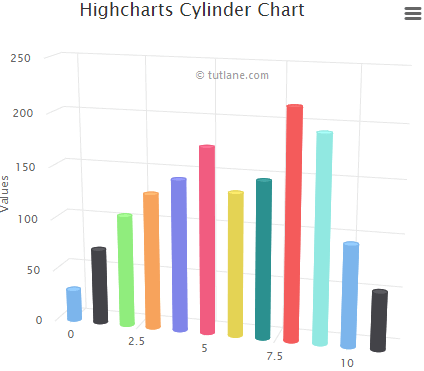
This is how we can create a 3D cylinder chart using highcharts library with required properties.