In the previous chapters, we learned how to setup highcharts library and how to create a chart with required configurations using highcharts library in our webpage. Now, we will learn how to create a vu meter chart using highcharts library with examples.
Following is the example of creating a VU meter chart by setting the required chart properties using highcharts library.
<html>
<head>
<title>Highcharts VU Meter Chart</title>
<script src="https://code.jquery.com/jquery-3.4.1.min.js"></script>
<script src="https://code.highcharts.com/highcharts.js"></script>
<script src="https://code.highcharts.com/highcharts-more.js"></script>
<script src="https://code.highcharts.com/modules/exporting.js"></script>
<script type="text/javascript">
$(function() {
Highcharts.chart('container', {
chart: {
type: 'gauge',
plotBorderWidth: 1,
plotBackgroundColor: {
linearGradient: { x1: 0, y1: 0, x2: 0, y2: 1 },
stops: [[0, '#FFF4C6'], [0.3, '#FFFFFF'], [1, '#FFF4C6']]
},
plotBackgroundImage: null,
height: 200
},
title: {
text: 'VU meter'
},
pane: [{
startAngle: -45,
endAngle: 45,
background: null,
center: ['25%', '145%'],
size: 300
}, {
startAngle: -45,
endAngle: 45,
background: null,
center: ['75%', '145%'],
size: 300
}],
tooltip: {
enabled: false
},
yAxis: [{
min: -20,
max: 6,
minorTickPosition: 'outside',
tickPosition: 'outside',
labels: {
rotation: 'auto',
distance: 20
},
plotBands: [{
from: 0,
to: 6,
color: '#C02316',
innerRadius: '100%',
outerRadius: '105%'
}],
pane: 0,
title: {
text: 'VU<br/><span style="font-size:8px">Channel A</span>',
y: -40
}
}, {
min: -20,
max: 6,
minorTickPosition: 'outside',
tickPosition: 'outside',
labels: {
rotation: 'auto',
distance: 20
},
plotBands: [{
from: 0,
to: 6,
color: '#C02316',
innerRadius: '100%',
outerRadius: '105%'
}],
pane: 1,
title: {
text: 'VU<br/><span style="font-size:8px">Channel B</span>',
y: -40
}
}],
plotOptions: {
gauge: {
dataLabels: {
enabled: false
},
dial: {
radius: '100%'
}
}
},
series: [{
name: 'Channel A',
data: [-20],
yAxis: 0
}, {
name: 'Channel B',
data: [-20],
yAxis: 1
}]
},
// Let the music play
function(chart) {
setInterval(function() {
if (chart.series) { // the chart may be destroyed
var left = chart.series[0].points[0],
right = chart.series[1].points[0],
leftVal,
rightVal,
inc = (Math.random() - 0.5) * 3;
leftVal = left.y + inc;
rightVal = leftVal + inc / 3;
if (leftVal < -20 || leftVal > 6) {
leftVal = left.y - inc;
}
if (rightVal < -20 || rightVal > 6) {
rightVal = leftVal;
}
left.update(leftVal, false);
right.update(rightVal, false);
chart.redraw();
}
}, 500);
});
});
</script>
</head>
<body>
<div id="container"> </div>
</body>
</html>
If you observe the above example, we created a VU meter chart using highcharts library with required properties.
When we execute the above highcharts example, we will get the result like as shown below.
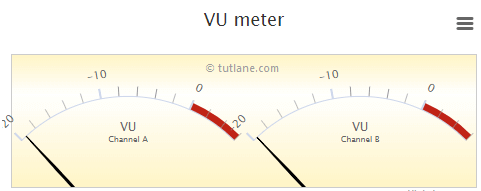
This is how we can create a VU meter chart using highcharts library with required properties.