In the previous chapters, we learned how to setup highcharts library and how to create a chart with required configurations using highcharts library in our webpage. Now, we will learn how to create a bubble chart using highcharts library with examples.
Following is the example of creating a bubble chart by setting the required chart properties using highcharts library.
<html>
<head>
<title>Highcharts Bubble Chart</title>
<script src="https://code.jquery.com/jquery-3.4.1.min.js"></script>
<script src="https://code.highcharts.com/highcharts.js"></script>
<script src="https://code.highcharts.com/highcharts-more.js"></script>
<script src="https://code.highcharts.com/modules/exporting.js"></script>
<script src="https://code.highcharts.com/modules/export-data.js"></script>
<script type="text/javascript">
$(function() {
Highcharts.chart('container', {
chart: {
type: 'bubble',
plotBorderWidth: 1,
zoomType: 'xy'
},
legend: {
enabled: false
},
title: {
text: 'Sugar and fat intake per country'
},
subtitle: {
text: 'Source: Euromonitor and OECD'
},
xAxis: {
gridLineWidth: 1,
title: {
text: 'Daily fat intake'
},
labels: {
format: '{value} gr'
},
plotLines: [{
color: 'black',
dashStyle: 'dot',
width: 2,
value: 65,
label: {
rotation: 0,
y: 15,
style: {
fontStyle: 'italic'
},
text: 'Safe fat intake 65g/day'
},
zIndex: 3
}]
},
yAxis: {
startOnTick: false,
endOnTick: false,
title: {
text: 'Daily sugar intake'
},
labels: {
format: '{value} gr'
},
maxPadding: 0.2,
plotLines: [{
color: 'black',
dashStyle: 'dot',
width: 2,
value: 50,
label: {
align: 'right',
style: {
fontStyle: 'italic'
},
text: 'Safe sugar intake 50g/day',
x: -10
},
zIndex: 3
}]
},
tooltip: {
useHTML: true,
headerFormat: '<table>',
pointFormat: '<tr><th colspan="2"><h3>{point.country}</h3></th></tr>' +
'<tr><th>Fat intake:</th><td>{point.x}g</td></tr>' +
'<tr><th>Sugar intake:</th><td>{point.y}g</td></tr>' +
'<tr><th>Obesity (adults):</th><td>{point.z}%</td></tr>',
footerFormat: '</table>',
followPointer: true
},
plotOptions: {
series: {
dataLabels: {
enabled: true,
format: '{point.name}'
}
}
},
series: [{
data: [{x: 95,y: 95,z: 13.8,name: 'BE',country: 'Belgium'},
{x: 86.5,y: 102.9,z: 14.7,name: 'DE',country: 'Germany'},
{x: 80.8,y: 91.5,z: 15.8,name: 'FI',country: 'Finland'},
{x: 80.4,y: 102.5,z: 12,name: 'NL',country: 'Netherlands'},
{x: 80.3,y: 86.1,z: 11.8,name: 'SE',country: 'Sweden'},
{x: 78.4,y: 70.1,z: 16.6,name: 'ES',country: 'Spain'},
{x: 74.2,y: 68.5,z: 14.5,name: 'FR',country: 'France'},
{x: 73.5,y: 83.1,z: 10,name: 'NO',country: 'Norway'},
{x: 71,y: 93.2,z: 24.7,name: 'UK',country: 'United Kingdom'},
{x: 69.2,y: 57.6,z: 10.4,name: 'IT',country: 'Italy'},
{x: 68.6,y: 20,z: 16,name: 'RU',country: 'Russia'},
{x: 65.5,y: 126.4,z: 35.3,name: 'US',country: 'United States'},
{x: 65.4,y: 50.8,z: 28.5,name: 'HU',country: 'Hungary'},
{x: 63.4,y: 51.8,z: 15.4,name: 'PT',country: 'Portugal'},
{x: 64,y: 82.9,z: 31.3,name: 'NZ',country: 'New Zealand'}]
}]
});
});
</script>
</head>
<body>
<div id="container" style="width: 100%; height: 400px;"> </div>
</body>
</html>
If you observe the above example, we created a bubble chart using highcharts library with required properties.
When we execute the above highcharts example, we will get the result like as shown below.
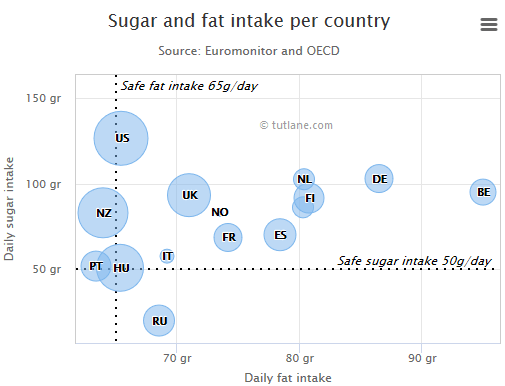
This is how we can create a bubble chart using highcharts library with required properties.